What are the top 5 SaaS metrics for 2023?

During periods of economic uncertainty, B2B SaaS companies must focus on fundamental metrics to navigate downturns and position themselves for future growth. Success will be found in keeping things simple and sticking to the basics.
The Five Essential Metrics
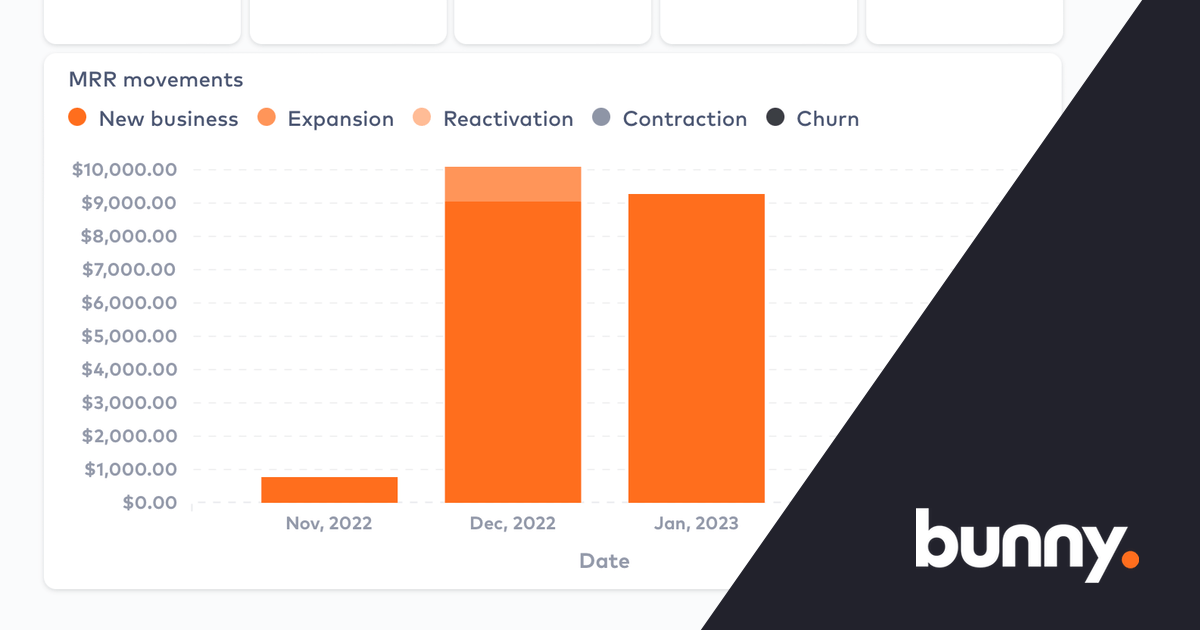
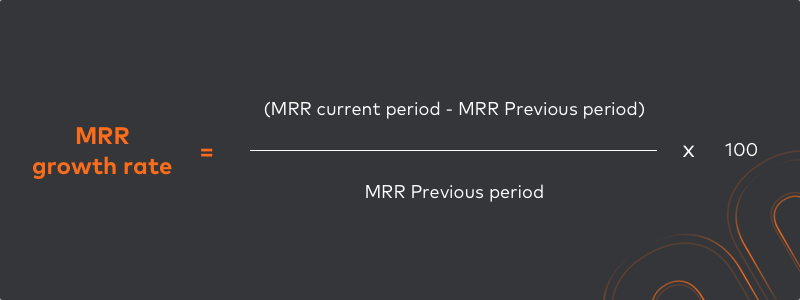
1. Monthly Recurring Revenue (MRR) Growth Rate
MRR growth rate measures the percentage change in revenue month-to-month. This metric reveals whether a company is acquiring new customers or losing existing ones. Positive growth indicates customer acquisition or expansion, while negative growth signals customer loss or slowing momentum.
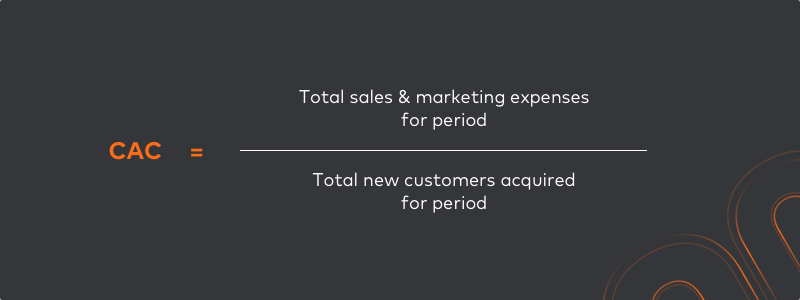
2. Customer Acquisition Cost (CAC)
CAC represents the total marketing and sales expenses required to gain a single customer. High acquisition costs during downturns present a red flag, as excessive spending can create negative cash flow and drain resources.
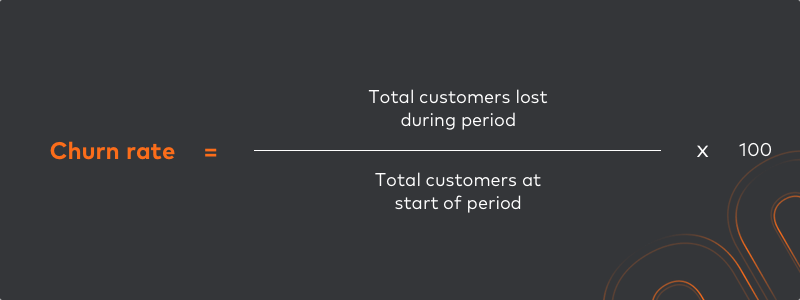
3. Churn Rate
Churn rate tracks the percentage of customers canceling subscriptions within a period. A high churn rate can indicate that customers are canceling their subscriptions due to economic hardship or dissatisfaction with the product.
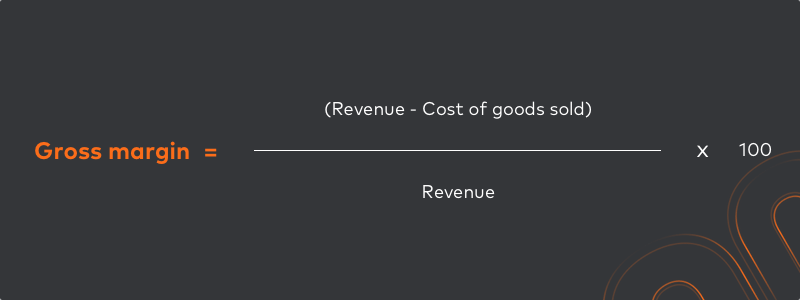
4. Gross Margins
Gross margins demonstrate whether revenue adequately covers production costs. Higher margins indicate operational efficiency and profitability, while lower margins may require cost reduction or price increases.
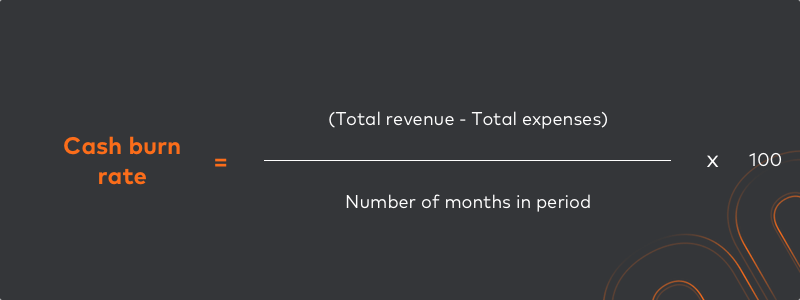
5. Cash Burn Rate
Cash burn rate measures how quickly a company depletes reserves. Monitoring this metric helps determine survival capacity during economic challenges and indicates cash flow health.
Conclusion
Companies should maintain positive MRR growth, monitor expenses, preserve healthy margins, and sustain customer satisfaction to weather economic storms and capitalize on recovery cycles.