A faster, deeper analytics experience in Bunny

Analytics should give you answers fast and let you keep asking questions until you understand what’s really happening in your business. That’s the standard we set when we rebuilt Bunny’s analytics from the ground up.
Every chart and filter you already rely on is still here - but the new experience loads 5x faster, lets you drill into the underlying data behind any chart or metric, and adds a set of new metrics across the dashboards. And wherever you land, the data is exportable to CSV.
Faster, with everything you already had
The first thing you’ll notice is speed. The upgraded analytics include all of the same charts and filters that were available before, but they load up to 5x faster. Date range, account, and other filters apply instantly, so exploring your data no longer means waiting on a spinner between every click.
Drill down into anything
The biggest change is navigation. Every chart, KPI, and metric is now a starting point rather than a dead end. Click into a number and you’ll see the underlying data behind it - then jump straight to the relevant account, invoice, or subscription to understand exactly what’s driving the figure.
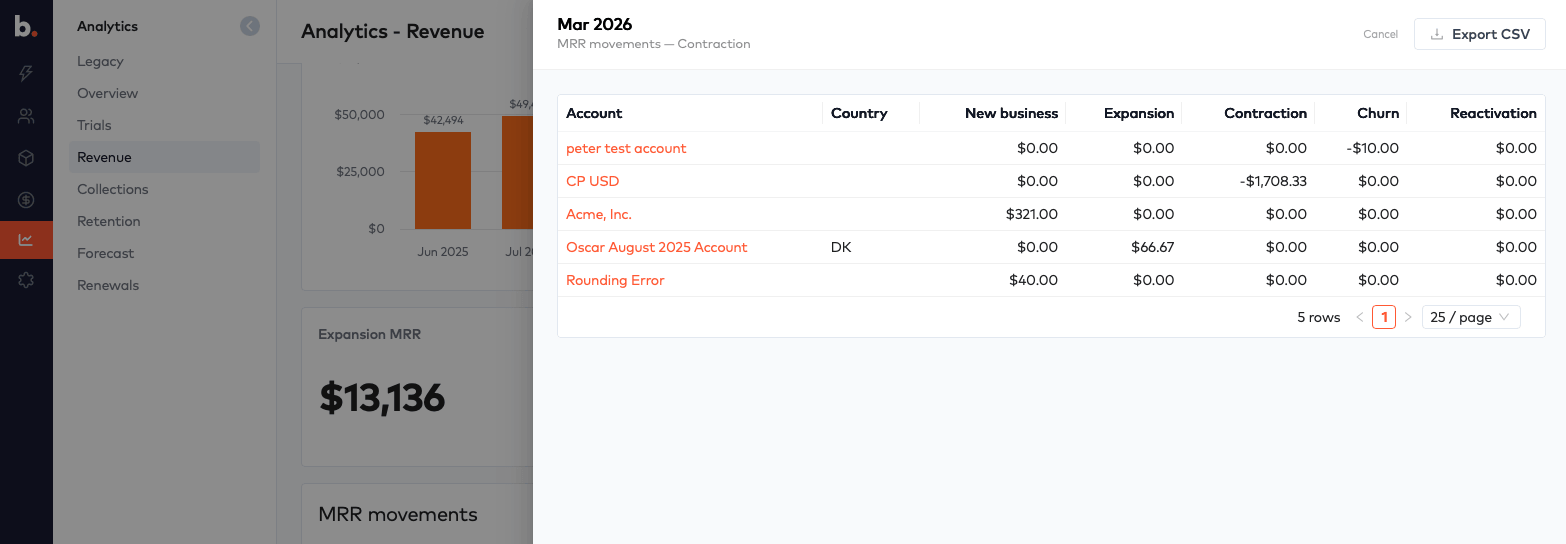
For example, drilling into a month of MRR movements shows you the exact accounts behind each contraction, expansion, churn, or new business figure - and links directly to those accounts so you can act on what you find.
New metrics across the dashboards
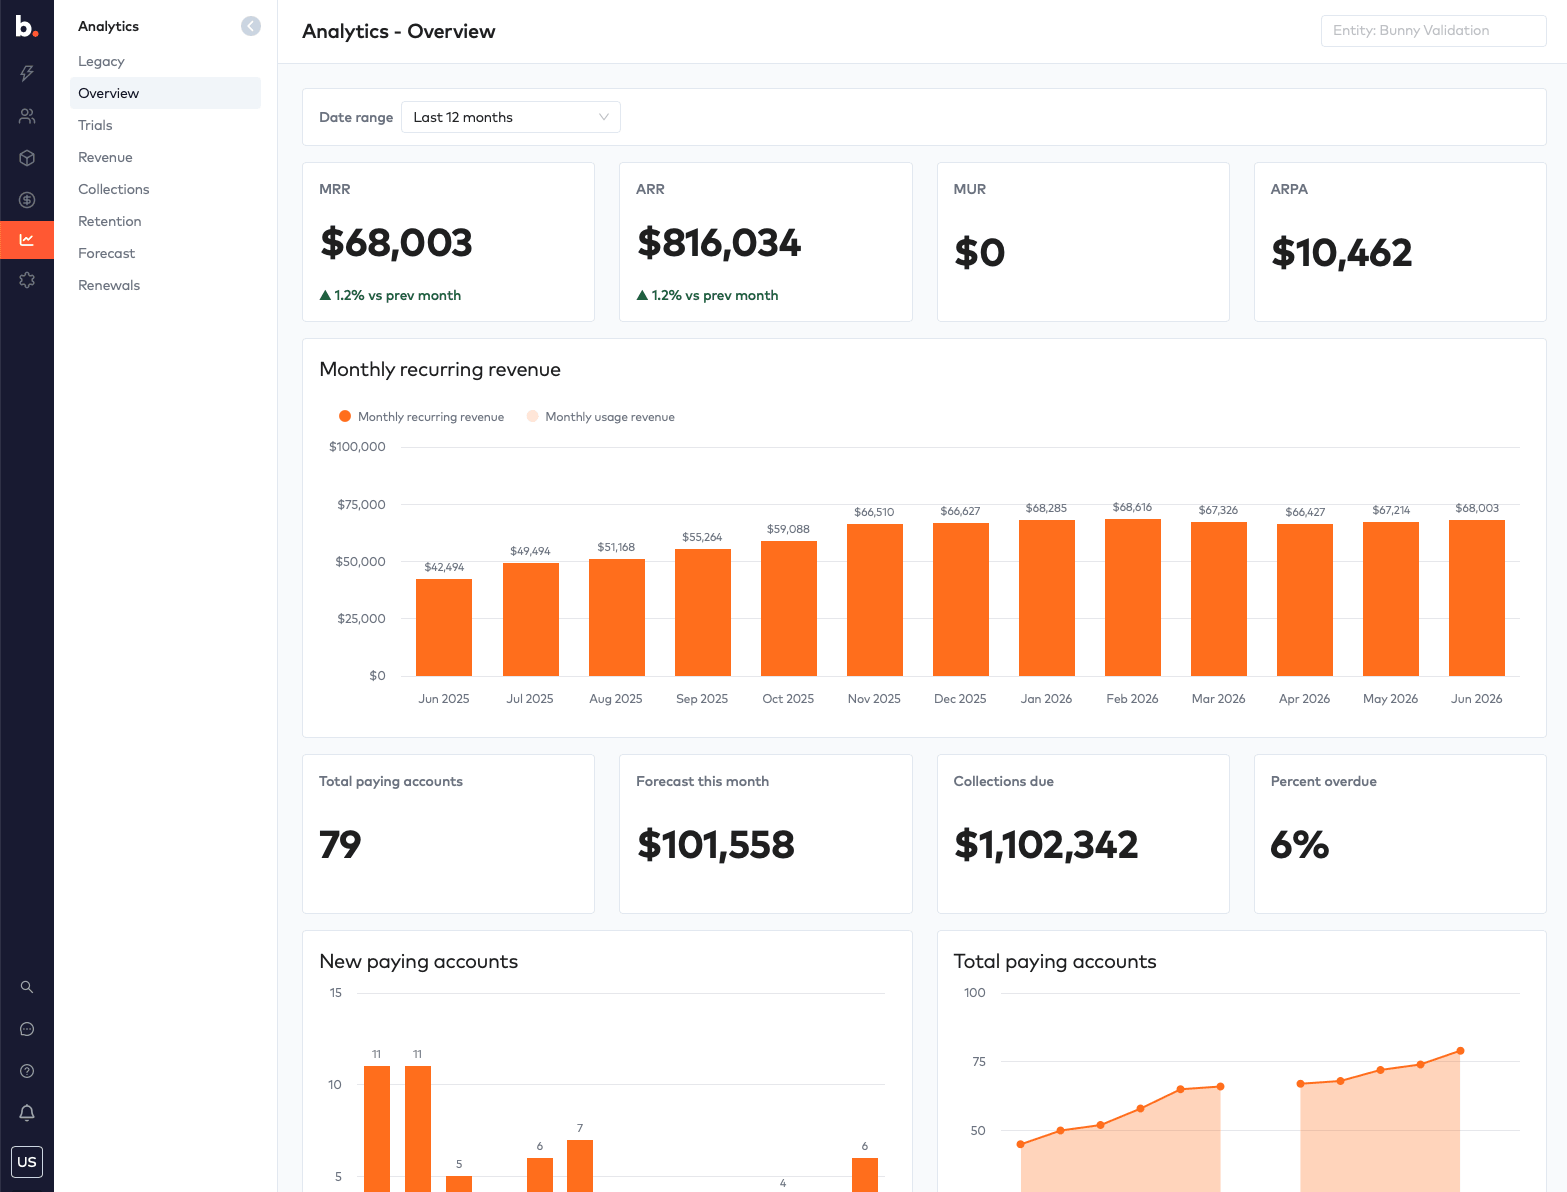
Overview
The Overview now brings together the headline numbers in one place - MRR, ARR, MUR, and ARPA - alongside new cashflow forecast and collections metrics, so you can see what’s coming in and what’s still owed without leaving the page.
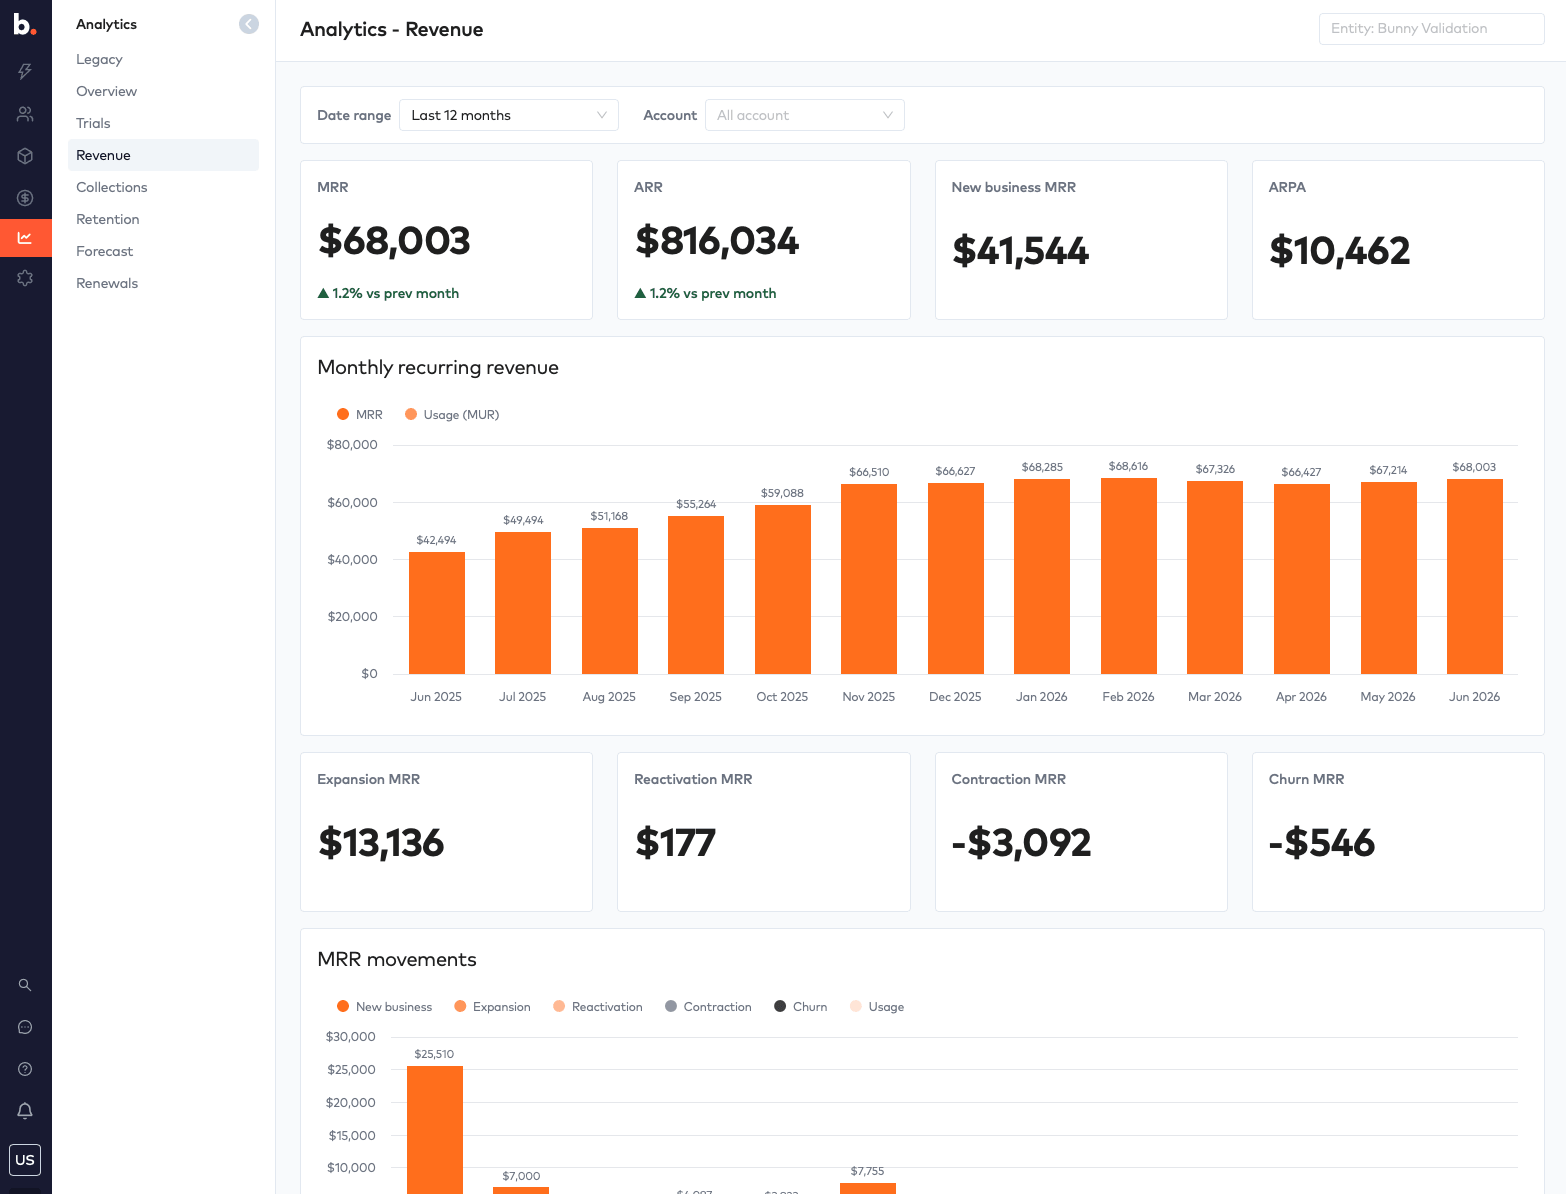
Revenue
The Revenue dashboard breaks down monthly recurring revenue and the full set of MRR movements - new business, expansion, reactivation, contraction, and churn - so you can see exactly how your revenue is changing month to month.
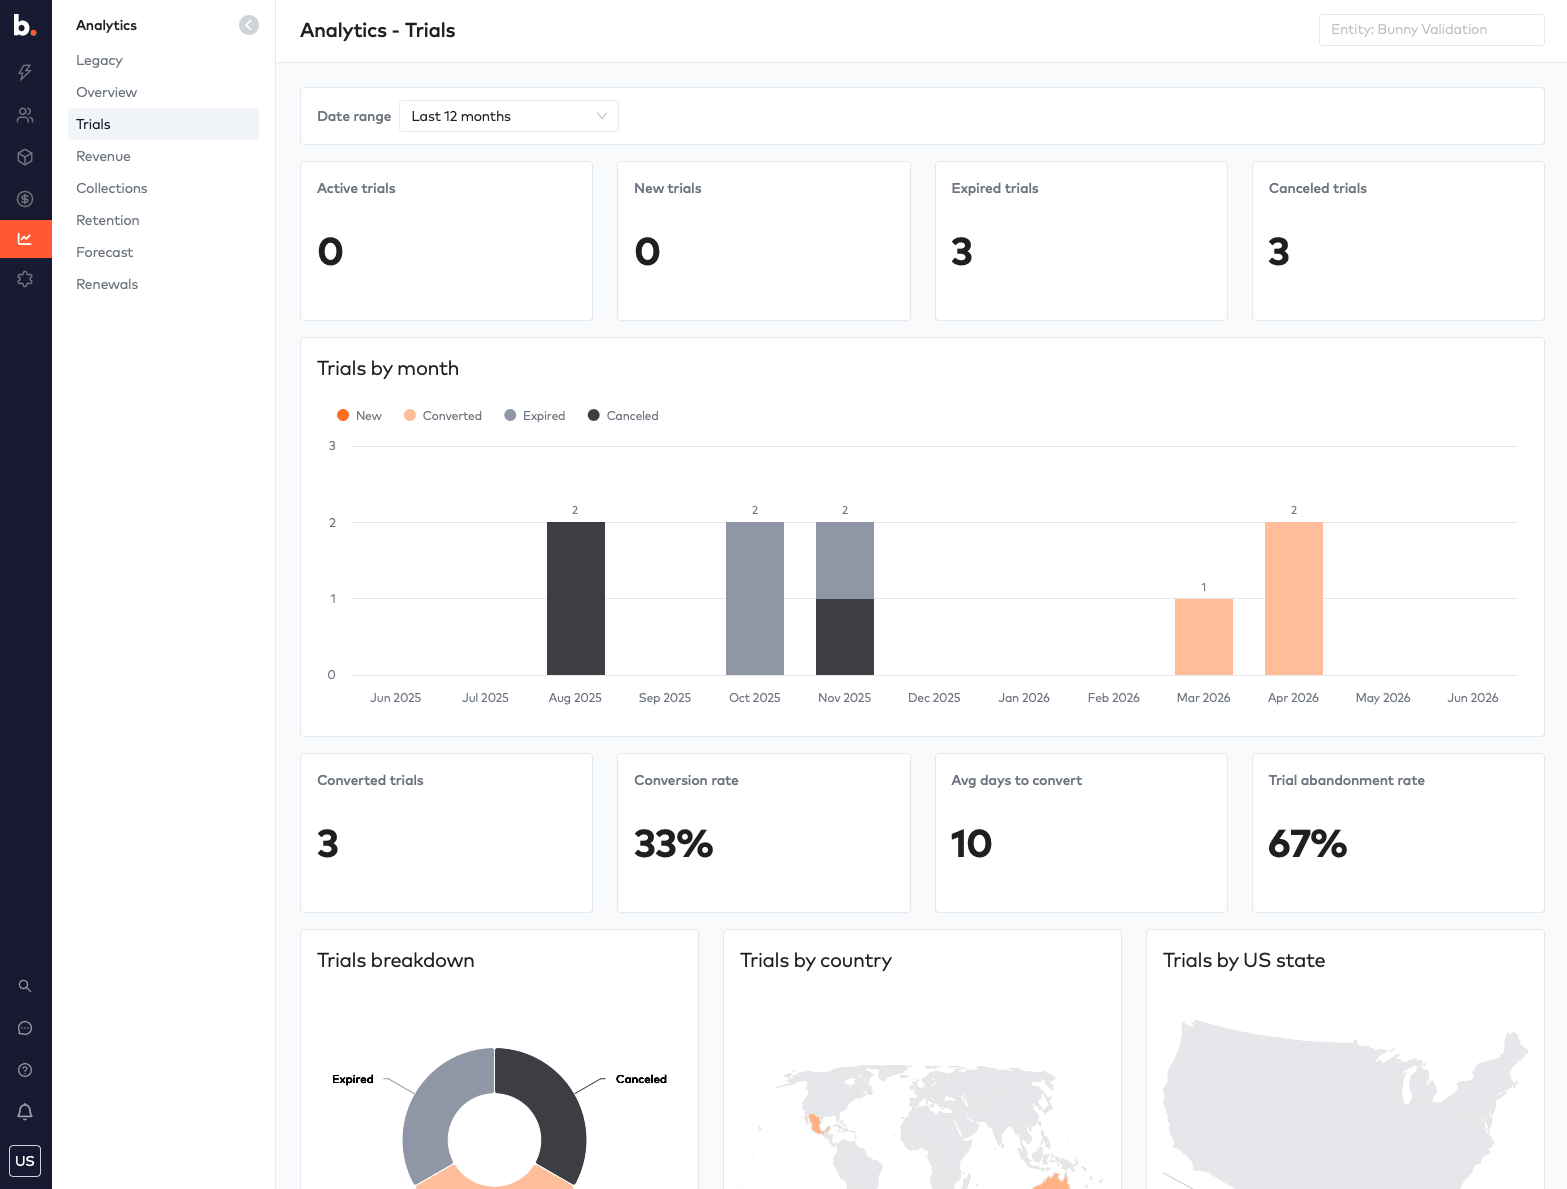
Trials
The Trials section adds new metrics around trial conversions and trial abandonment rates, including conversion rate, average days to convert, and a breakdown of trials by month, country, and US state - giving you a clear picture of how well your trial funnel is performing.
Collections
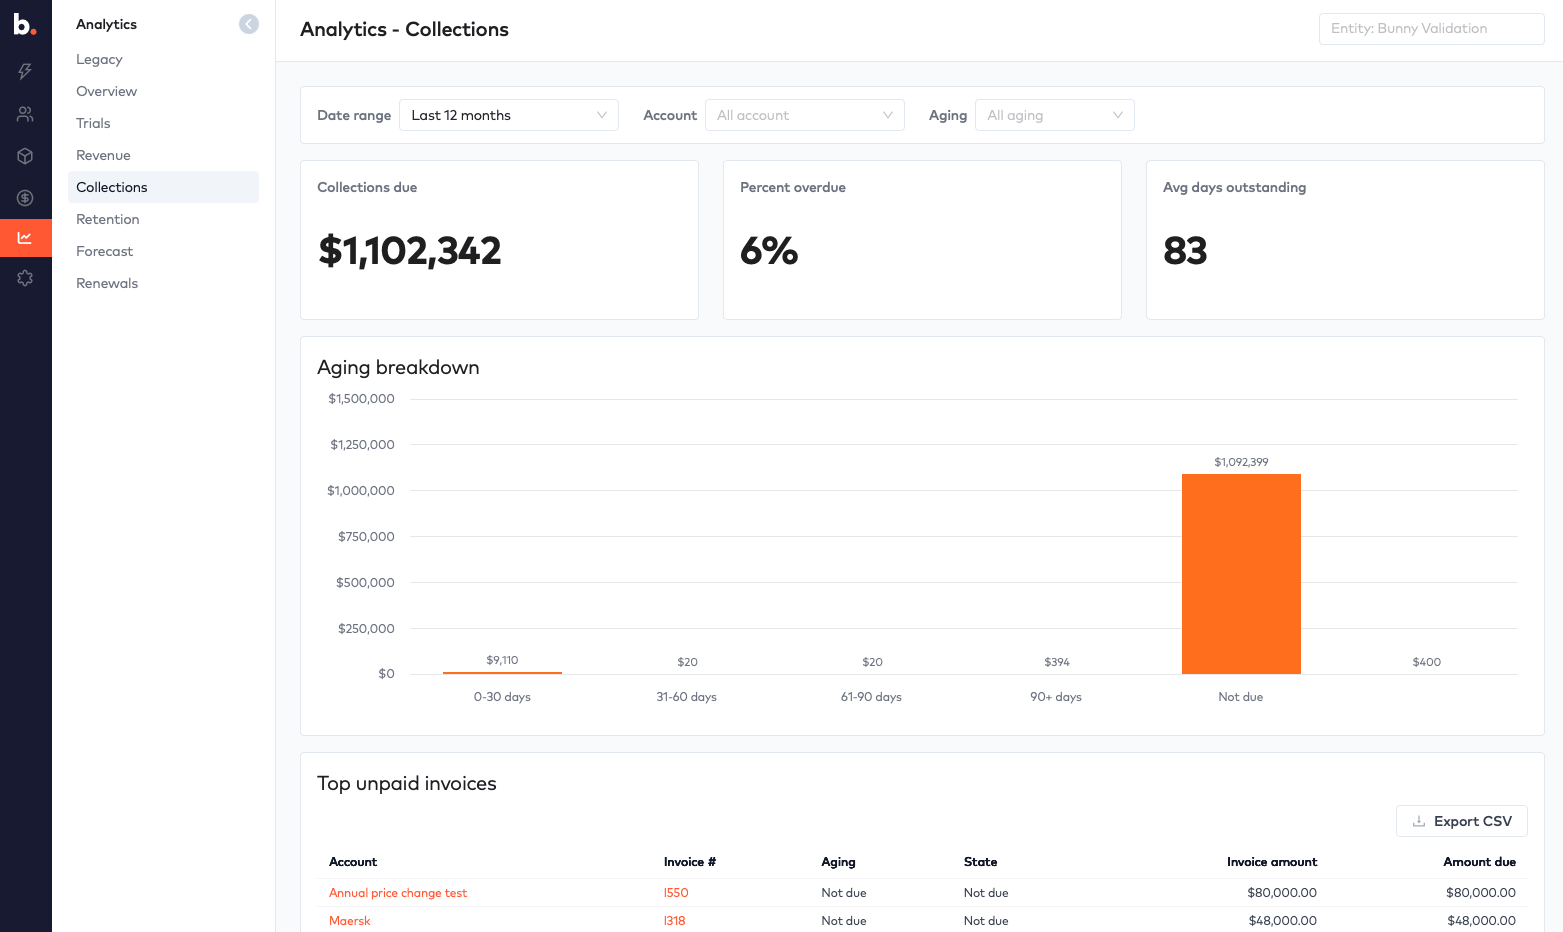
The Collections dashboard gives you a real-time view of what’s outstanding - collections due, percent overdue, and average days outstanding - with an aging breakdown and a list of your top unpaid invoices so you know exactly where to focus.
Retention
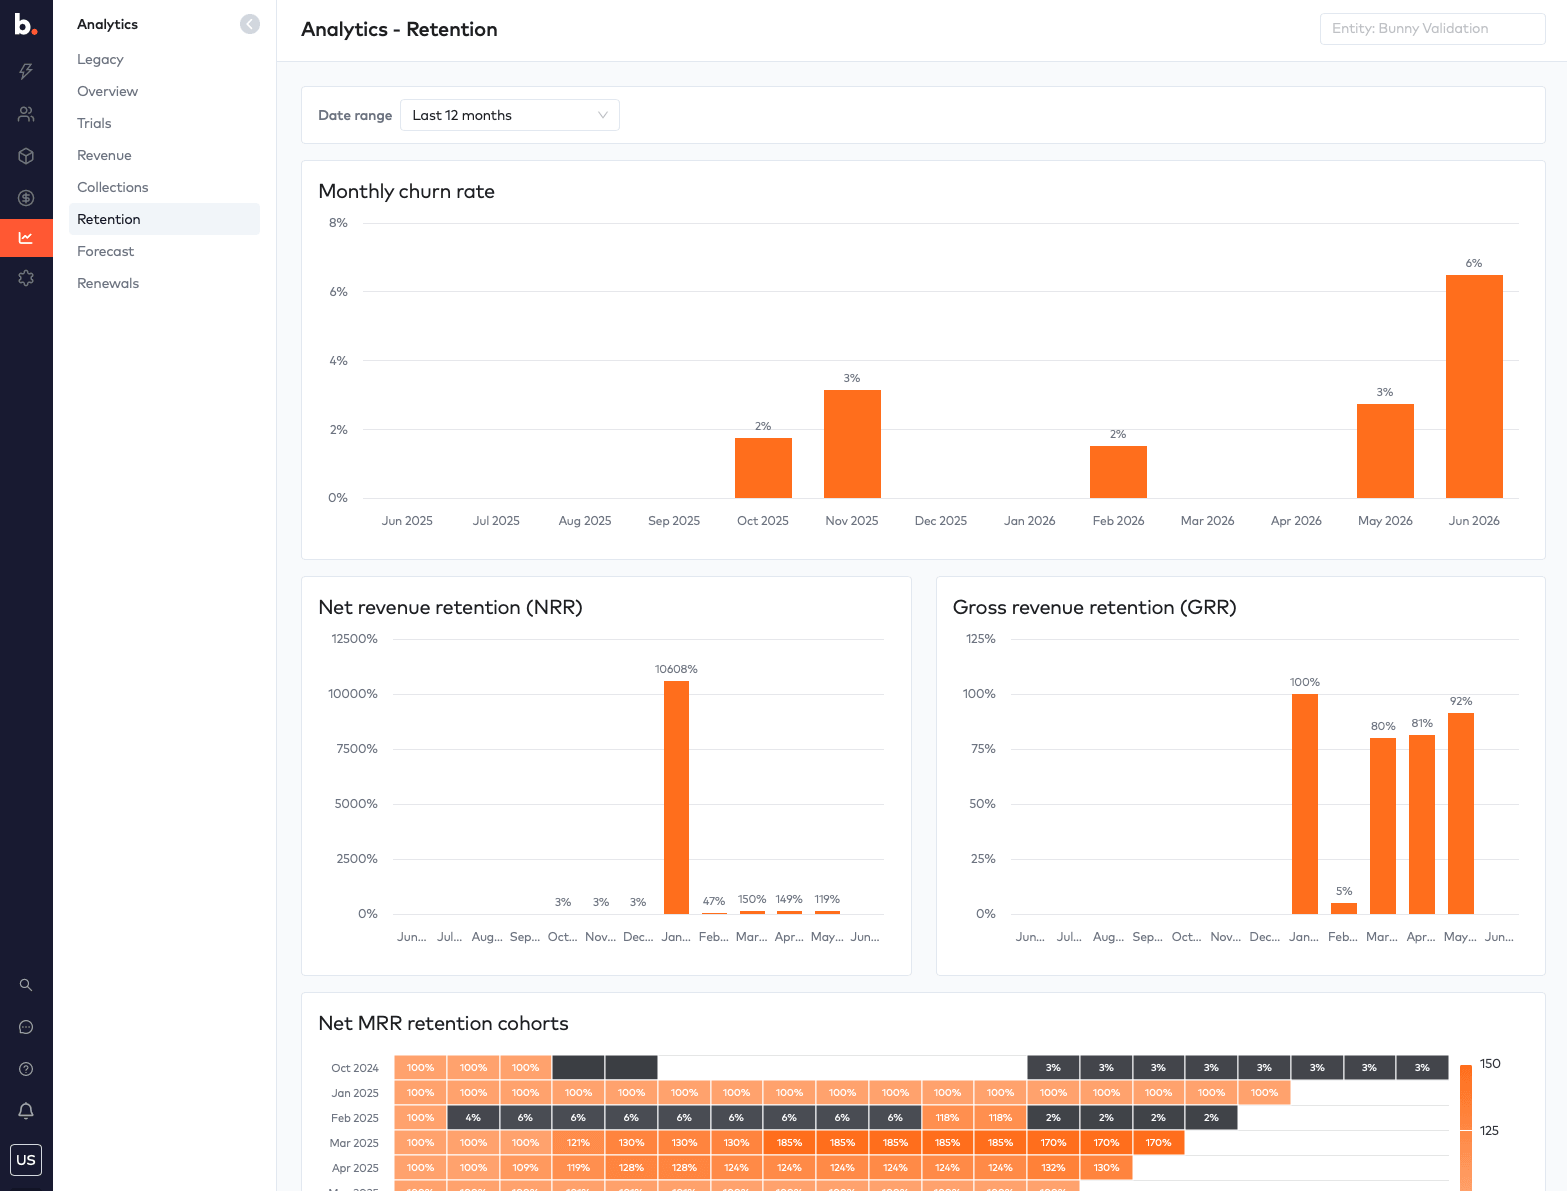
Retention now supports drilldowns on the Net Revenue Retention (NRR) and Gross Revenue Retention (GRR) charts, plus the ability to drill into MRR retention cohorts - so you can pinpoint exactly which cohorts of customers are growing and which are declining.
Forecast
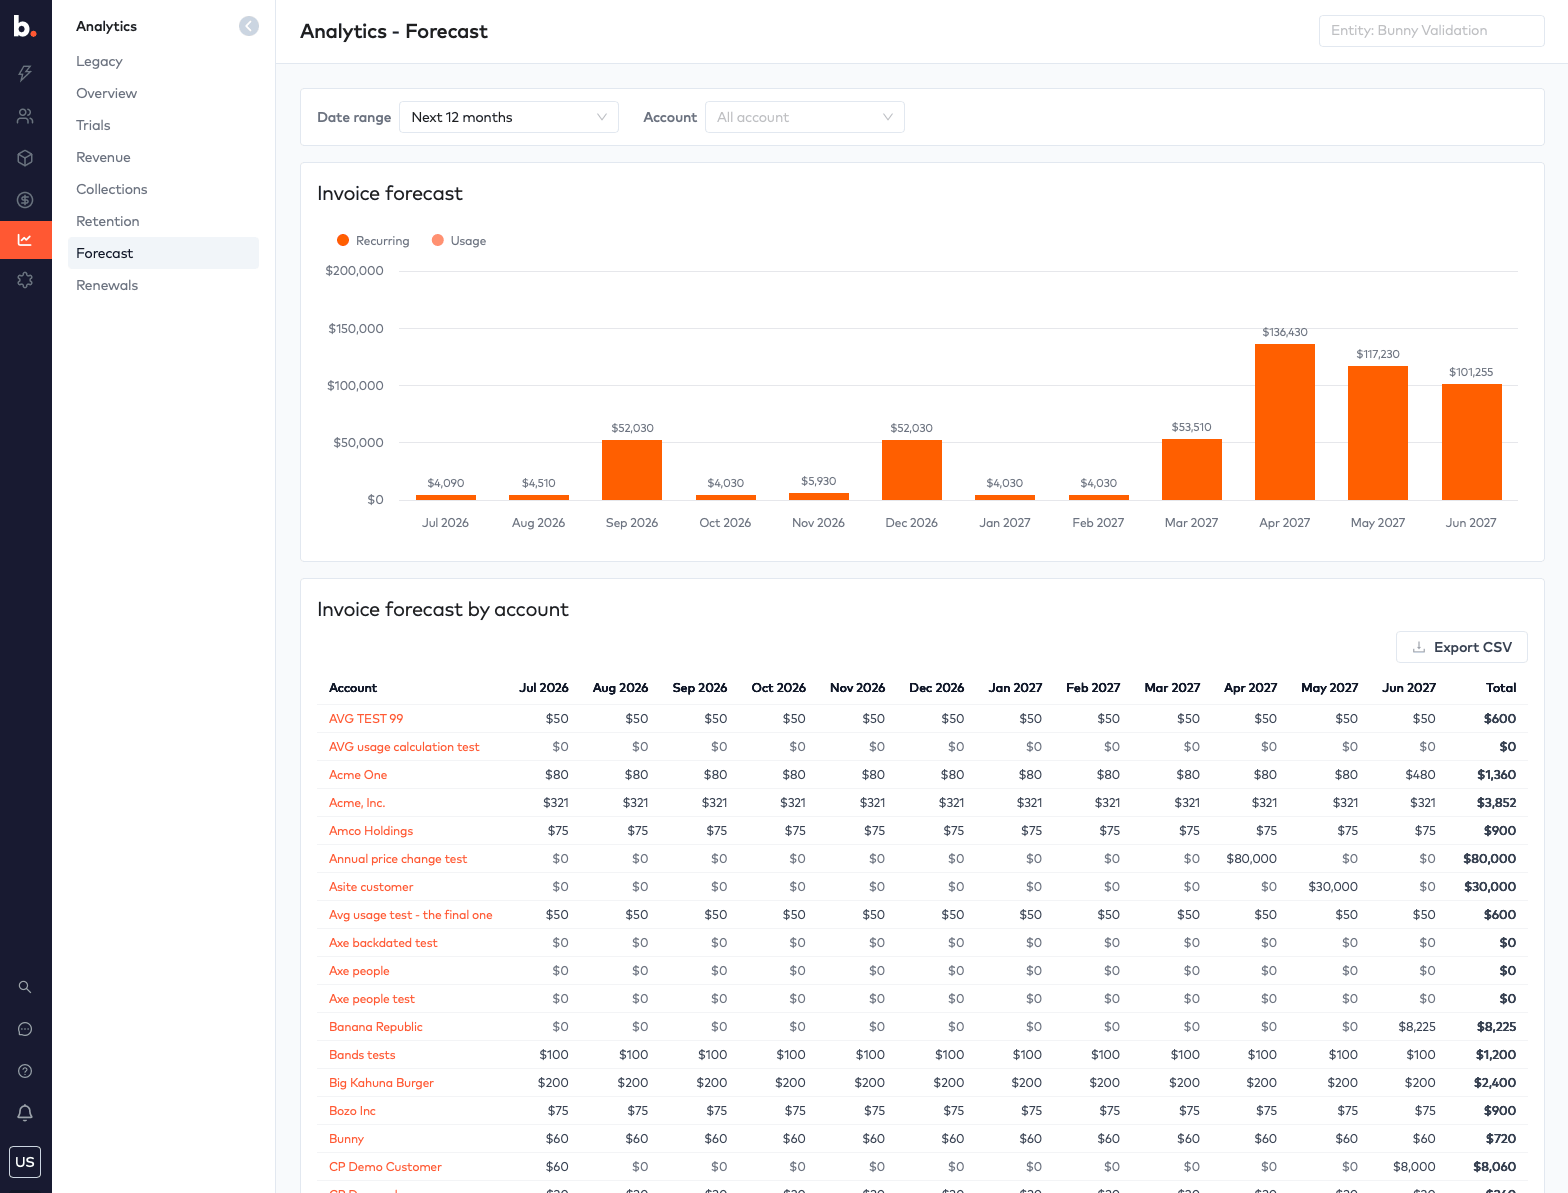
The Forecast dashboard runs significantly faster and over new charts, projecting both recurring and usage revenue across the next 12 months, with a per-account breakdown you can export.
Renewals
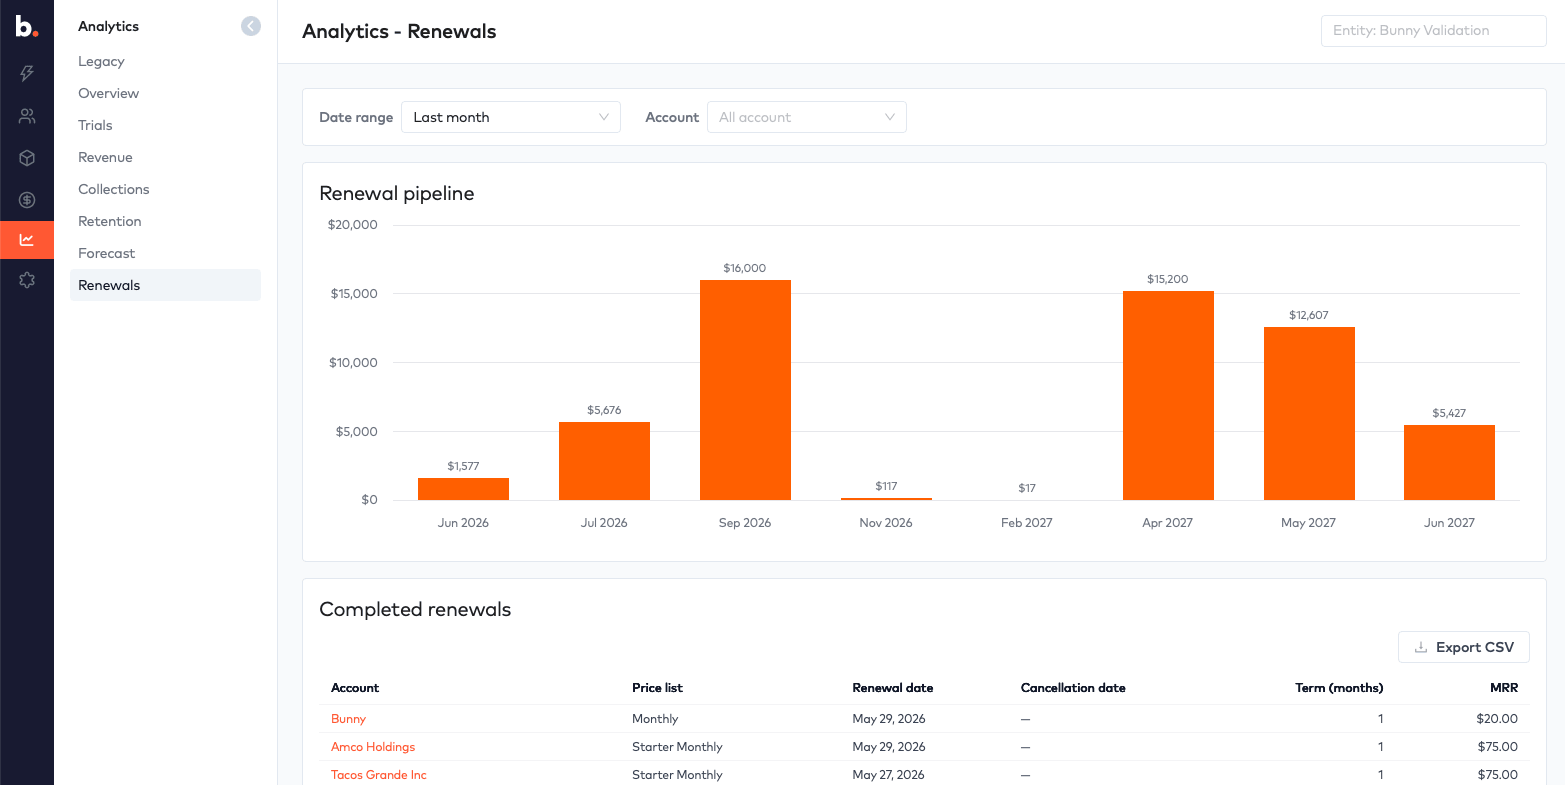
The Renewals dashboard also runs significantly faster over new charts, giving you a clear view of your renewal pipeline by month alongside a table of completed renewals.
Export everything
Finally, all of this data is exportable. Every drilldown and table includes CSV export, so whether you’re handing numbers to your finance team, building a board deck, or pulling data into your own models, it’s just a click away.
Get Started
The upgraded analytics are available now in Bunny under Analytics. If you have questions or feedback, get in touch - we’d love to hear how you’re using it.