Bunny is the single source of truth
Without a single source of truth, you're always questioning the data
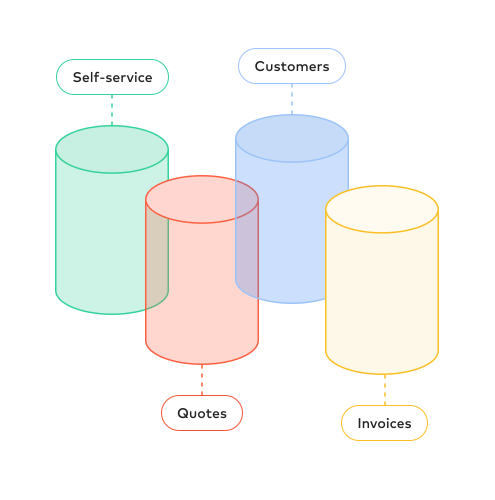
The resulting pains:
See what one source of truth actually looks like
A two-minute walkthrough of Bunny analytics — MRR and ARR movements, trials, retention, collections and invoice forecasting, all calculated from live billing data rather than reconciled together at month end.
Read the transcript
Bunny Analytics is organized into several sections. In addition to the overview, you can navigate to trials, revenue, collections, retention, forecast, and renewals. The overview dashboard gives you a quick snapshot of your business. Here, you can view monthly and annual recurring revenue, monthly revenue over time, and the number of new and total paying accounts.
The Trials dashboard helps you monitor who is trying the product and how those trials are performing. You can see trials per month, which ones are converting, and which ones are dropping off. You can also see where trials are coming from across the US and globally. The Revenue dashboard provides a deeper look at your revenue.
In addition to MRR and ARR, you can view monthly revenue over time here, along with the movements. This is a drill down where you can see new business, expansion, contraction, and outright churn. We also track compound growth rate, as well as revenue per state and country. The Collections dashboard helps you stay on top of customer collections.
You can see how your outstanding revenue is aging from zero to ninety days, along with the top unpaid accounts. On the Retention dashboard, we take a closer look at how effectively you are retaining your customers. At the top, you can see monthly churn rate, followed by net retention and gross retention, which are two very important metrics for SaaS businesses.
Finally, you have a cohort chart that shows how well you are retaining customers over time. The Forecast dashboard lets you predict how much revenue you're collecting in the coming months. You can see the monthly numbers at the top, as well as the detailed invoices being collected below. Finally, we have the renewals. The renewal amounts per month are shown in the top chart, followed by detailed accounts in the table below. And this is Bunny Analytics.

Other problems we solve
This is one of several revenue operations problems B2B SaaS teams bring to Bunny — see the full list of problems we solve.
- Complex renewals Upsells and renewals become the majority of your deals. Bunny handles the subscription context, proration, ...
- Manual quote-to-cash Spreadsheet quoting has no guardrails and no approvals. Bunny automates the full quote-to-cash process, fro...
- Price optimization Win competitive deals without giving away margin. Bunny gives you discounts, ramps, and custom terms — with...
- Self-service billing Let customers manage their own subscriptions. Bunny's portal and embeddable React components work for any p...
- Slow time to market Launch new pricing, products, and plans without engineering bottlenecks. Bunny decouples your pricing layer...
- Usage-based billing Bunny is usage-based billing software for B2B SaaS: meter usage by API, rate it on tiered or volume pricing...
The RevOps expert your team never had.
- Type "send upgrade quotes to all starter plan accounts" — done in seconds
- Know which renewals need you this month, while there is still time to do something about it
- Find every overdue invoice in one question, instead of one account at a time
No credit card required. Cancel anytime.