How Can SaaS Analytics Improve My Business Decision-Making?

How healthy is your quote-to-cash?
12 questions on pricing, renewals, billing and reporting. Takes two minutes.
Take the assessmentSaaS analytics improves decision-making by replacing gut feel with a live, trusted view of how revenue is actually moving: which customers are expanding, which are at risk, which plans make money and where cash will land next quarter. When your SaaS analytics are built on billing and subscription data rather than spreadsheets, every team argues from the same numbers.
Most SaaS leaders already have plenty of dashboards. The problem is that they disagree. Sales reports bookings from the CRM, finance reports revenue from the accounting system, and product reports usage from its own warehouse. Good SaaS analytics closes that data silo gap so a pricing change, a hiring plan or a renewal push can be judged on one version of the truth.
In this guide we cover what a SaaS analytics platform does, the metrics that drive real decisions, what is different about B2B SaaS analytics, and how to choose SaaS analytics software that your finance and revenue teams will both trust.
What is a SaaS analytics platform?
A SaaS analytics platform collects subscription, billing, payment and usage data and turns it into recurring revenue metrics such as MRR, ARR, churn, net revenue retention and customer lifetime value. The best platforms calculate these from the system that actually bills customers, so the numbers reconcile with invoices and the general ledger.
There are three broad kinds of SaaS analytics tools:
- Product analytics tools track feature usage and user behaviour. They tell you what people do, not what they pay.
- BI and data warehouse tools can model anything, but someone has to build and maintain every metric definition. (If you go this route, syncing subscription data into your warehouse beats manual exports.)
- Billing-native SaaS analytics sits inside your subscription billing system. We cover the trade-offs in the advantage of embedded analytics for revenue operations. Metrics update the moment a quote is signed, an invoice is paid or a subscription changes.
For revenue decisions, billing-native SaaS analytics is usually the foundation. Product and BI tools add context on top, but they cannot tell you what a customer is contracted to pay next month.
Why spreadsheets break as you grow
Spreadsheet models work until the first mid-term upgrade, multi-year deal or custom discount. After that, each change has to be keyed in by hand, and the MRR figure in the board deck stops matching the billing system. A SaaS analytics platform removes that manual layer, which is where most reporting errors start.
Which SaaS analytics metrics drive better decisions?
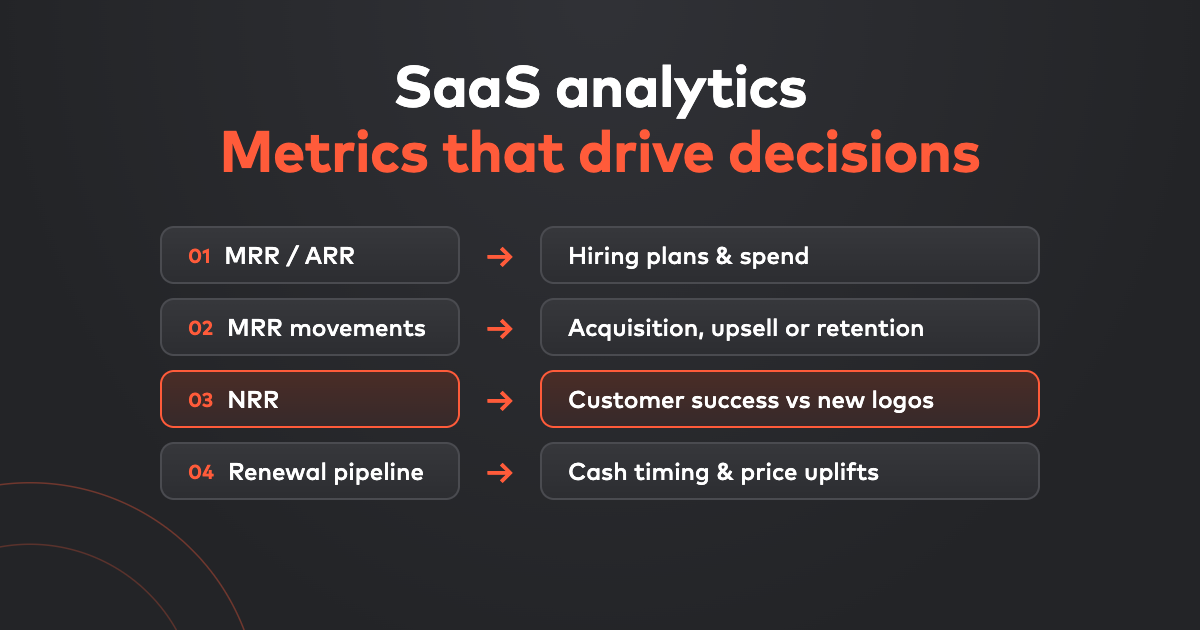
The value of SaaS analytics is not the metric itself but the decision it unlocks. This table maps the core recurring revenue metrics to the calls they inform. For a shorter primer, see our top SaaS metrics.
| Metric | What it shows | Decision it informs |
|---|---|---|
| MRR / ARR | Contracted recurring revenue today | Hiring plans, spend limits, fundraising timing |
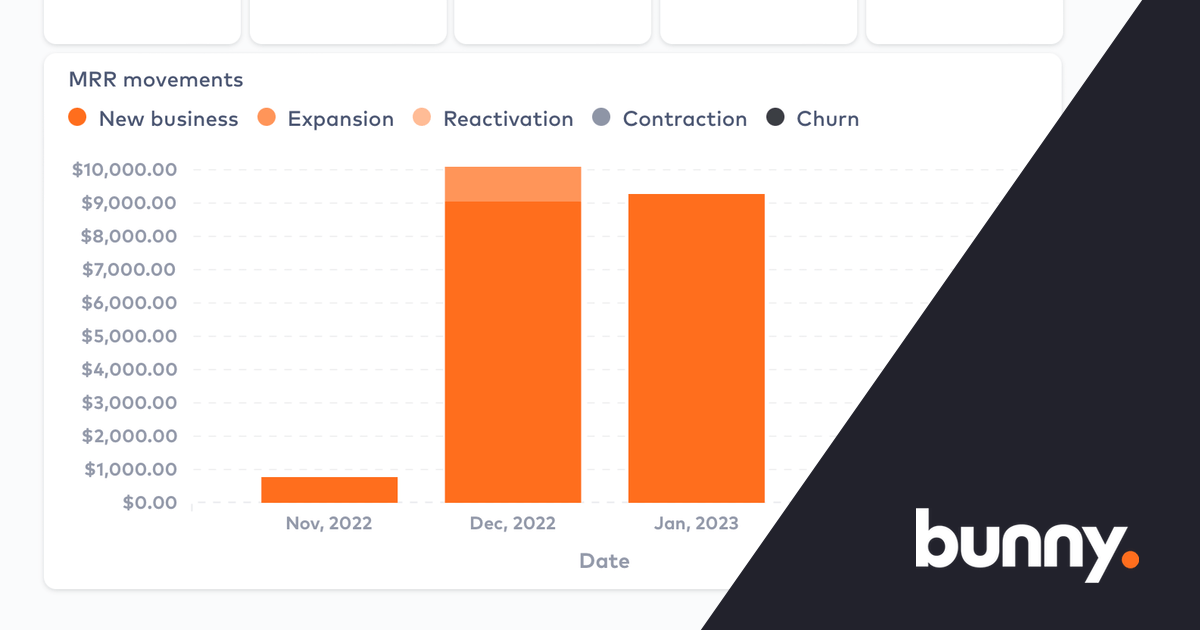
| MRR movements (new, expansion, contraction, churn, reactivation) | Why revenue changed this month | Where to invest: acquisition, upsell or retention |
| Net revenue retention (NRR) | Revenue kept and grown from existing customers | Whether to prioritise customer success or new logos |
| Gross churn and logo churn | Revenue and customers lost | Which segments, plans or onboarding paths need fixing |
| Average revenue per account (ARPA) | Typical deal size by segment | Pricing and packaging changes, sales territory design |
| Renewal pipeline | Contracts due in the next 30, 60 and 90 days | Account management focus and price uplift timing |
| Deferred and recognised revenue | Revenue earned versus billed | Cash planning and audit readiness |
Pricing decisions
When SaaS analytics breaks revenue down by plan and price list, you can see which tiers attract expansion and which stall. That turns a pricing review from opinion into evidence, and lets you test a new price on new customers while tracking the impact.
Retention and expansion decisions
MRR movement data shows whether growth comes from new logos or existing accounts. If contraction is rising in one segment, account managers can act before renewal rather than after churn. Cohort retention views show whether newer customers behave differently from older ones, and AI-assisted renewal management helps turn those signals into expansion.
Cash and hiring decisions
Forward-looking views, such as an invoice forecast and upcoming renewals, show finance what cash will land and when. That makes it safer to commit to hires or campaigns without waiting for month-end close.
What makes B2B SaaS analytics different?
B2B SaaS analytics has to handle deals that consumer subscription models never see. Contracts are negotiated, priced per seat or per unit, ramped over several years and changed mid-term. If your analytics only understands monthly card payments, your numbers will be wrong for your largest customers.
Good B2B SaaS analytics accounts for:
- Quotes and custom pricing. Discounts in CPQ, ramp deals and non-standard terms need to flow straight into MRR, not be re-keyed after signature. That is why quoting means clean data.
- Mid-term changes. Seat increases, upgrades and co-terminated add-ons should show up as expansion on the day they take effect.
- Mixed billing models. Many companies run self-serve card customers alongside invoice-billed enterprise accounts. Both need to land in the same metrics.
- Account hierarchies. Parent and child entities, multiple subscriptions per account and consolidated invoicing all affect how revenue is reported.
- Revenue recognition. Annual prepaid contracts are billed up front but earned monthly, so finance needs recognised revenue alongside MRR.
This is why B2B companies often outgrow Stripe dashboards and generic BI. See what happens when salespeople touch Stripe Billing and our Stripe Billing alternatives guide. The analytics are only as good as the contract data underneath them.
How do I choose SaaS analytics software?
Choose SaaS analytics software that calculates metrics from your billing source of truth, handles your real contract complexity and gives sales, account management and finance the same numbers. Use these questions when evaluating SaaS analytics tools:
- Where do the numbers come from? Metrics built from live subscription and invoice data stay accurate. Metrics built from exports drift.
- Can it explain changes? Look for MRR movement reporting, not just a single MRR line.
- Does it cover B2B deals? Test it with a ramp deal, a mid-term seat increase with proration and a multi-year prepaid contract.
- Does it include revenue recognition? Finance should not need a separate tool to reconcile billed and earned revenue.
- Does it connect to your CRM and accounting system? Account managers need subscription data in HubSpot or Salesforce, and finance needs it in QuickBooks or Xero. Browse all Bunny integrations.
- Can you ask questions in plain English? AI assistants that query live billing data save hours of report building. See sales and revenue tools AI agents can actually operate.
How Bunny approaches SaaS analytics
Bunny is a quote-to-cash platform for B2B SaaS covering subscription billing, quoting and revenue, so its SaaS analytics come straight from the quotes, subscriptions and invoices it manages. Teams get:
- MRR, ARR and MRR movements (new, expansion, contraction, churn and reactivation) updated as deals close and subscriptions change, in a faster analytics experience
- Revenue recognition schedules that spread prepaid invoices across their service period, so finance sees earned revenue next to MRR
- A forward view of upcoming invoices and renewals for cash and account planning
- CRM sync with HubSpot and Salesforce, plus accounting sync with QuickBooks Online and Xero
- An MCP server and the RevOps agent so AI assistants such as Claude can answer revenue questions against live account data
Because quoting, billing and analytics share one data model, a discount approved in a quote is the same discount reported in MRR and recognised in the ledger.
Make your next decision with numbers you trust
If your board deck, CRM and billing system each show a different revenue figure, the fix starts at the source. See how Bunny supports finance teams or book a demo of Bunny to see quoting, billing and revenue reporting on one data model.

SaaS metrics you don't have to assemble by hand
NRR, GRR, ARR, churn and cohort retention calculated from your live billing data — not a month-end spreadsheet.